How to Perform a Quadratic Regression on a TI-89
Open up Apps > Data/Matrix Editor > New, type in something under variable, and press Enter. Note: Variable names cannot match system variables (such as linreg, expreg, quadreg).

Next you have to enter in a set of data, so let's just use the sample dataset
| time | population |
| c1 | c2 |
| 1 | 1 |
| 2 | 4 |
| 3 | 9 |
| 4 | 16 |
| 5 | 25 |
| 6 | 36 |
| 7 | 49 |
| 8 | 64 |
| 9 | 81 |
| 10 | 100 |
An easy way to type this set of data in would be enter the 1-10 under "c1", and then if you go over and highlight "c2", type in "c1^2," and the "c2" column will be populated with the squares of the "c1" values.

Now go to F2 > Plot 1 > F1. Under "Plot Type" choose scatter, under "x" and "y" put "c1" and "c2" respectively, and press Enter.

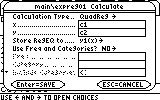
When you're back at the Data/Matrix Editor screen, go to F5, and change "Calculation Type" to "QuadReg." Once again for "x" and "y" enter in "c1" and "c2" respectively, under "Store RegEQ to," choose "y1(x)," and press Enter.
Now we just have to set a window for this graph, so let's use 0 for x-min and y-min, 10 for x-max, and 100 for y-max.

So that's how to do a quadratic regression, but how about if we wanted to do the same for an exponential or cubic function. Below is a table listing a few common regressions, and under the Calculate (F5) screen, you can just change which one you enter.
| Type | Command | Formula |
| Cubic Regression | CubicReg | y=ax^3+bx^2+cx+d |
| Exponential Regression | ExpReg | y=ab^x |
| Linear Regression | LinReg | y=a+bx |
| Logarithmic Regression | LnReg | y=a+b(ln(x)) |
| Power Regrssion | PowerReg | y=ay=ax^b |
| Quadratic Regression | QuadReg | y=ax^2+bx+c |
posted by Anonymous at 10:59 AM
![]()

0 Comments:
Post a Comment
<< Home